This article aims to provide a detailed approach to calculating the costs associated with data breaches, enabling organizations to make informed decisions about their defense strategies and budget allocations.
As Douglas Hubbard stated in 2023 “The single biggest cybersecurity risk is, I believe, that the risk assessment methods themselves are ineffectual. If these methods are nothing more than a kind of “analysis placebo” then risk mitigations will be misguided, resources will be wasted, and risks will not actually be reduced. The biggest vulnerabilities in cybersecurity are these broken, but widely used, risk assessment methods. This means the highest priority patch is building a better risk assessment method. And all the research consistently points to the same solutions: move away from ambiguous “high/medium/low” labels and adopt quantitative methods that have been shown to improve estimates and decisions measurably”. Hubbard made this claim in the work of Jesus Caetano, an Antwerp Management School researcher who examined as a global CISO of a large multinational how he could better balance security efforts against his biggest Cyber risks.
This work demonstrates the need for accurate risk quantification of security breaches’ and financial impact have Increased in attention. To effectively counteract threats like phishing, ransomware, and other forms of cyberattacks, it’s essential to choose the right protective measures. Understanding the potential costs of risk is vital in balancing risks and making informed budgetary decisions.
This article focuses on quantifying the risk of data breaches using data from sources like IBM, Ponemon, and scientific literature. Data breaches will act as an example of quantifying risk. However, with the right data, you can also use the same techniques to model against other types of risks. In a later stage of the article, we highlight how you can model yourself and how you can model company specific variables. Such as security measures that you already have or want to implement. We also link the return on security investment to provide better insight into where to gain “the biggest bang for the security buck”.
Key Learning Outcomes
This article will help you grasp several critical concepts for estimating the cost of a data breach applicable to various risk types. You will learn to:
- Identify the components involved in calculating data breach costs.
- Compute the financial impact of data breaches using random simulations.
Estimating data Breach costs to predict the potential cost of a data breach, gathering relevant data and applying a specific formula is necessary. We will involve reports like “The Cost of a Data Breach” and research for calculating breach likelihood. We will also use a technique called Monte Carlo Analysis: recommended in the book “How to Measure Anything in Cybersecurity Risk”.
Monte Carlo simulations involve creating a range of possible outcomes of data breach costs through numerous random simulations. This method provides a comprehensive view of potential financial impacts.
How we will calculate
We will calculate the cost of data breaches by first figuring out the likelihood of a data breach. Second, the impact of data breaches. We will then use the likelihood and impact data to conduct thousands of simulations using the Monte Carlo analysis. (Figure 1)

Lastly, as a bonus, we will calculate the potential effect and ROI of implementing security measures.
Calculating likelihood
The likelihood of a data breach refers to the probability of such an event occurring. In this article we will use specific ranges and percentages instead of descriptors like high, medium, or low. For instance, you might assess a 20% to 50% chance of a breach occurring within a year. Depending on your needs, this probability can be calculated over different time frames, such as five years. The Likelihood is also depending on contextual influences like geo-politics, espionage in specific industries etc. Scenario planning and looking at the value of your data to criminals helps you to determine how susceptible your company is to an event. To assess your data attractiveness researchers at Privacy Affairsi publish every year the Dark Web Price Index 2023. On the other hand research has shown us that the likelihood of a data breach correlates with the number of records potentially affected. A formula from a scientific publication [1], which considers the number of affected records and other organizational characteristics, will be used to calculate the likelihood.
Calculating Impact
The cost per affected record largely determines the impact of a data breach. Reports like the “Cost of a Data Breach Report 2021” by IBM and Ponemon provide average costs, which include expenses related to forensic investigations, communications, and loss of business. A more detailed breakdown of potential costs is given by Bobbert and Timmermans in their paper “How Zero Trust can reduce the cost of a breach” ii However, these averages may need adjustment to reflect your organization’s and industry specific circumstances more accurately.
Simulating Potential Losses
The Monte Carlo method is employed to simulate potential data breach costs. This involves setting variables like the average cost per record, potential breach sizes, and specific organizational characteristics. You can estimate the total potential loss over a set period, such as five years, by running thousands of simulations.
Incorporating Security Measures
By integrating security measures into these calculations, you can assess their cost-effectiveness. For example, adding data encryption can significantly reduce the likelihood of a breach. You can determine which strategies offer the best return on investment by running simulations with various security measures. In earlier papers a “breach reduction scheme” was proposed on which measure contributes in both Likelihood and Impact. This paper was made after Poneme Institutes claimed that Zero Trust measures can reduce the economic impact of a breach by 75%. The authors reflected the measures on the Root Cause of 25 breaches analysed by Antwerp Management School.
Figuring out the likelihood
Understanding the likelihood of a data breach is critical to cybersecurity risk management. Security professionals often categorize this likelihood into mystic terms such as high, medium, or low. However, a more precise approach involves using specific ranges and percentages. This method, recommended by Douglas Hubbard in his book “How to Measure Anything in Cybersecurity Risk,” allows for a more accurate assessment of risk likelihood and impact. For instance, there is a 20% to 50% chance of a data breach occurring within a year. It’s generally more practical to calculate this likelihood over multiple years, such as five years, though this period can be adjusted based on specific needs.
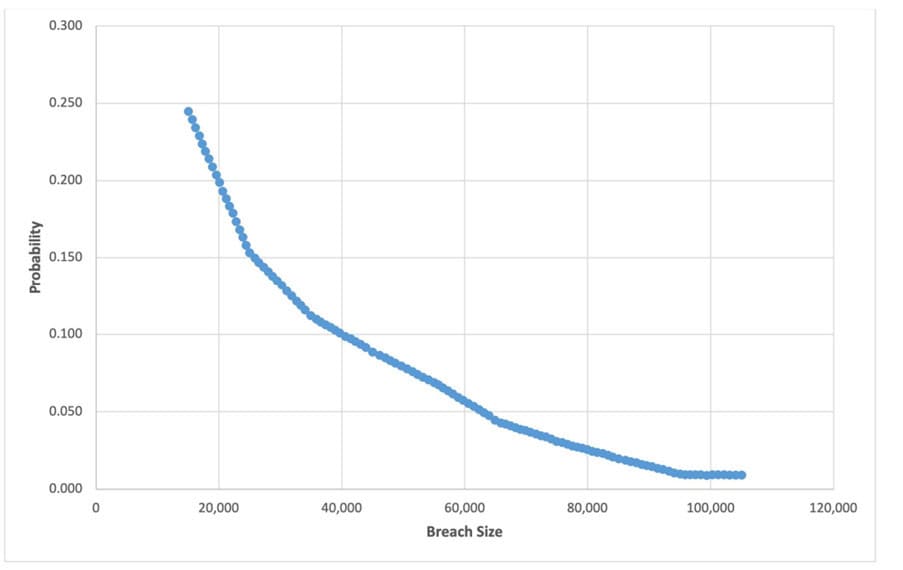
The likelihood of a data breach is significantly influenced by the number of records that could potentially be compromised. According to the research, the more records are involved, the lower the probability of a breach. This relationship can be quantified using a formula, which calculates the likelihood based on the size of the breach. The formula suggests that the likelihood of a breach decreases as the number of affected records increases.
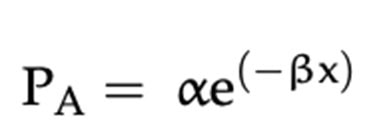
The result of the formula shown in a graph. Notice how the likelihood decreases the more records are involved. (Figure 3)
Adding characteristics
The current calculation is based on average. And your organization likely deviates from the average. Thus, to refine the accuracy of this formula, it’s beneficial to incorporate specific characteristics of an organization. These characteristics act as multipliers, increasing or decreasing the likelihood of a breach. For example, the organization’s industry impacts the likelihood, just like if the organization encrypts sensitive data. Both organizational factors and measures are seen as characteristics. The formula can be adjusted to include various factors such as seen in figure 4.
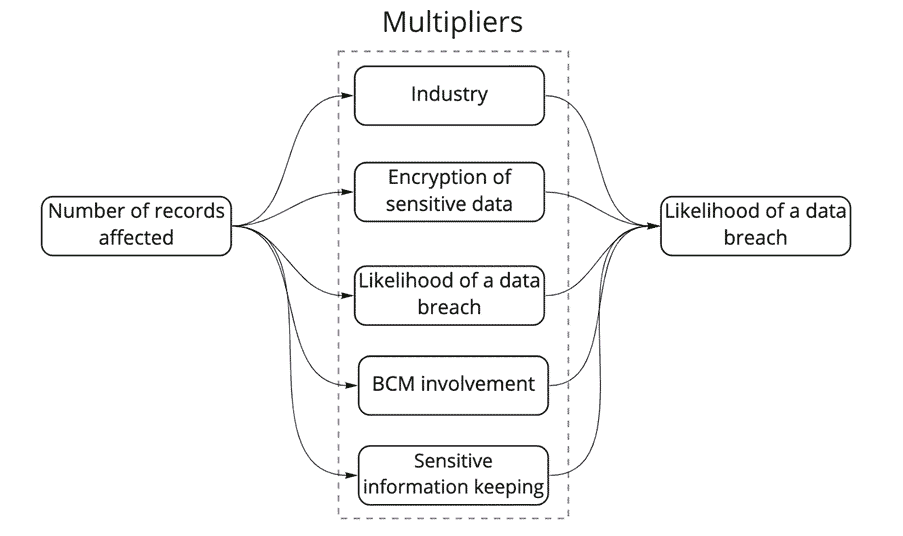
Each of these factors can be assigned a numerical value that reflects its impact on the likelihood of a data breach. For instance, keeping sensitive information for only three months might reduce the likelihood significantly compared to retaining it for longer periods. This the main value of GDPR principles like “data proportionality”, “lawfulness of processing” and data retention periods, these measures limit companies to collect too much data.

The research [1] suggests the following characteristics displayed as a formula in Figure 6.

Implementation
The formula would be adapted to include these characteristics in a practical implementation. The process involves defining each characteristic with a specific numerical value and then integrating these into the calculation. The formula considers the standard likelihood (determined by the number of records potentially affected) and adjusts it according to the combined effect of the organizational characteristics.
By incorporating these specific factors, the formula becomes a more powerful tool for predicting the likelihood of a data breach for your specific organization. It allows organizations to input their unique attributes and get a tailored risk estimation rather than to rely on generic market data.
Determining the Impact: Average Cost Per Record
A practical approach to estimating the average cost per record involves referencing industry reports, such as the “Cost of a Data Breach Report 2021” by IBM and Ponemon. This report suggests an average cost of $161 per impacted record, so we calculate with that amount here in our article. This cost typically encompasses various expenses, including:
- Forensic investigations to understand the breach’s nature and scope.
- Communications efforts, both internal and external, related to the breach.
- Loss of turnover, reflecting the potential decrease in revenue due to the breach.
These costs are categorized into direct and indirect expenses. Direct expenses include hiring forensic experts, outsourcing hotline support, and offering services like free credit monitoring to affected individuals. Indirect costs cover internal investigations, communication efforts, and the estimated financial impact of customer loss due to reduced trust or diminished acquisition rates. Some breaches have catastrophic consequences, for example the hack on the City of Antwerp was initially estimated lower than the final economic externalities calculation. The city stated: “Loss of income is not included in the said amount. Think of urban swimming pools that were forced to be free, cultural centers that had no income and the parking fines that were not collected. As a result, the impact is still approaching a hundred million euros.”
Adapting the Average Cost to Specific Organizational Contexts
As said $161 per record is a general estimate. Therefore, organizations might need to adjust this figure based on several factors, such as:
- The extent of business loss resulting from the breach.
- The hourly costs of security personnel involved in the investigation.
- The impact on IT and communication staff in terms of lost hours.
- Potential legal fines and penalties associated with the breach.
For this example, we’ll proceed with the average cost of $161 per record. However, organizations are encouraged to modify this figure based on their situation and risk profile.
Calculating the Total Impact
With the average cost per record established, the next step is to calculate the total financial impact of a data breach. This is done by multiplying the number of records affected by the average cost per record. For this article we used Python, this calculation can be encapsulated in a function that takes the size of the breach and the cost per record as inputs, returning the total cost of the incident. By understanding and applying these principles, organizations can more accurately estimate the financial repercussions of data breaches and determine with more precision their mitigating measures. We come to that in a later stage of the article.
Random simulations to quantity risk
The final step in assessing data breach risk involves estimating the potential financial loss over a given period. This is achieved by combining our understanding of the likelihood of a breach with the average cost per record. The goal is to simulate various data breach scenarios over time and calculate the potential financial impact.
Monte Carlo Simulation for Data Breach Cost Estimation
To perform this estimation, we use a Monte Carlo simulation, a technique developed in the 1940s by Stanislaw Ulam, John von Neumann, and Nicholas Metropolis.[7] This method involves creating many simulations to model the probability of different outcomes. It’s a widely used approach in various fields, including risk assessment for power plants, supply chains, insurance, project management, financial risks, and cybersecurity. Although some perceive the method as complex, we will highlight the essentials below in order to equip a broader audience of Risk and security professionals.
Setting Up the Simulation Parameters
The simulation requires setting up specific parameters:
- Impact per Record: We already destilled the estimated cost of $161 per record from previous steps.
- Likelihood Multipliers: These are factors that adjust the likelihood of a breach based on specific conditions, such as the nature of the breach (e.g., criminal attack), motive of hacker groups, whether data is encrypted, the involvement of business continuity management in incident response, the type of industry, and the duration for which sensitive information is kept.
- Breach Size Range: This is the potential range of the size of data breaches, which we can assume to be between 1 and 100,000 records.
- Number of Simulations: For robust and valid results, many simulations, such as 10.000, are used.
- Time Frame: The simulation can be set over a period of five years, to understand the long-term risk and its economic impact (over time).
Conducting the Simulation
The simulation involves iterating through each year of the chosen time frame and for each simulation:
- Randomly selecting a breach size within the defined range.
- Calculating the probability of a breach of that size occurring, based on our likelihood formula.
- Determining if a breach occurs in that year, based on the calculated probability.
- If a breach occurs, calculating the cost for that year by multiplying the breach size by the average cost per record.
Visualizing and Interpreting the Results
After running the simulations, the results can be visualized, typically using a histogram, to show the distribution of total costs over the 5-year period. This visualization helps in understanding the range and frequency of potential financial impacts from data breaches. (Figure 7)
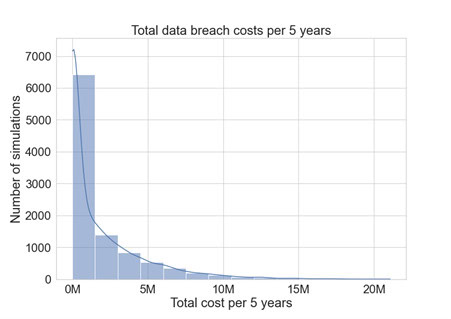
For example, the histogram might show that in most simulations, the total cost over 5 years is less than approximately $5 million. It might also reveal a smaller chance of the total cost reaching as high as $16 million. Such insights are valuable for comparing the potential losses from data breaches against the budget allocated for cybersecurity measures.
Expanding the Calculation to Include Security Measures
Now that we have a comprehensive setup for calculating the potential financial impact of data breaches, we can enhance this model by incorporating various cybersecurity measures. These measures can significantly alter the likelihood of a data breach, thereby affecting the overall risk profile.
An example: Applying encryption
For example, let’s consider the impact of adding encryption to protect sensitive data. According to earlier research, encryption can reduce the likelihood of a data breach, with a multiplier effect of 0.51 on the likelihood. This means that implementing encryption can significantly decrease the risklikelihood and impact of a data breach.
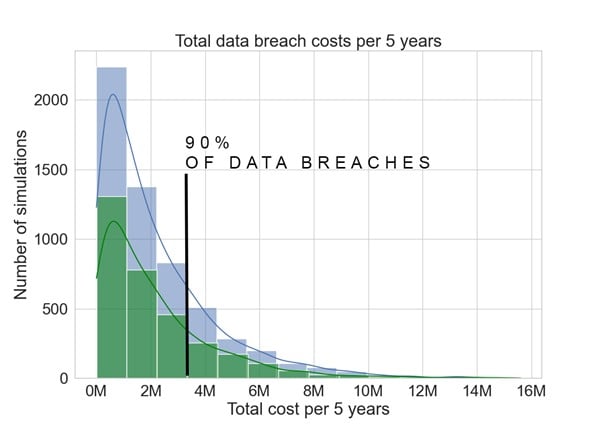
Figure 8, the impact of encryption on data breach simulations. Green is the total cost with encryption; blue is the total cost without encryption.
Impact of Encryption: By incorporating encryption into our simulation, we see that the total cost over five years in 90% of the scenarios would be less than $3 million. (Figure 8) This represents a potential saving of $2.46 million over five years compared to scenarios without encryption.
If your encryption implementation costs around $0.5 million, you would have a ROSI (return on security investment) of 4.29x.
Exploring Additional Security Measures
Beyond encryption, numerous other technical and non-technical security measures can be considered, each potentially affecting the likelihood as well as the impact of a data breach and its economic externalities.
- Multifactor Authentication (MFA): Adding MFA to applications can significantly reduce the risk of unauthorized access.
- Reducing Access to Sensitive Data: Applying the principle of “least privilege” is limiting the number of people with access to sensitive data. This can decrease the likelihood of intentional and accidental breaches.
- Access Management: Implementing robust access management and Kipling based policies ensures that only authorized personnel have access to sensitive data, and only at the required times. The Kipling method [5] is also known as the 5W+1H method by Rudyard Kipling. Kipling is common practice in the auditing field [6]. Conditions for access are formulated in an abstract (i.e., technology-independent manner) via the Kipling method: who gets access, what exactly access is provided, when, (from) where, why, and how (i.e., under which conditions is access granted).
For each of these measures, you can estimate a “multiplier” that reflects its impact on reducing the likelihood of a data breach. By running simulations with these multipliers, you can assess whether the cost of implementing a particular security measure is justified by reducing potential data breach costs.
Conclusion
Quantifying the financial impact of a risk event allows organizations to confidently address questions such as “How much should we invest in cybersecurity?”, “What will be the return on investment?” and “Do we have enough cyber insurance coverage?” iii
Companies increasingly shift towards a risk-based approach to Cybersecurity and operational risk, as compliance with regulations alone does not do the job. A quantitative approach to cyber risks has proven more effective in cyber security management. It gives the necessary value associated to each risk, enabling companies to make better informed decisions for their investments, monitoring of their risk exposure and better insights on the return on investment in their entire security portfolio. Monte Carlo simulations help to equip nowadays CISO’s with more ammunition to build their narrative in the board. They can utilise more effectively their knowledge of economic models and inform boards in a better way on where to spend their money.
Bonus
As a bonus, we are linking to an original article on securityscientist.net. This article contains the code if you want to reproduce the calculation:
https://www.securityscientist.net/blog/a-guide-to-calculating-the-cost-of-data-breaches
References
[1] Algarni, A. M., Thayananthan, V., & Malaiya, Y. K.. Quantitative Assessment of Cybersecurity Risks for Mitigating Data Breaches in Business Systems, 2021.
[2] IBM Corporation, Ponemon Institute.Cost of a Data Breach Report 2021. Ponemon Institute, 2021.References
[1] Algarni, A. M., Thayananthan, V., & Malaiya, Y. K.. Quantitative Assessment of Cybersecurity Risks for Mitigating Data Breaches in Business Systems, 2021.
[2] IBM Corporation, Ponemon Institute.Cost of a Data Breach Report 2021. Ponemon Institute, 2021.
[3] Hubbard, D. W., & Seiersen, R, How to Measure Anything in Cybersecurity Risk, 2016
[4] Verizon, 2021 data breach investigations report, 2021.
[5] R. Kipling, “Just so stories,” Double Day page, 1902.
[6] D. Mills, “Working Methods,” Quality Auditing, no. DOI: 10.1007/978-94-011-0697-9_10, pp. 122-142, 1993.
[7] IBM, “What is Monte Carlo simulation?”, https://www.ibm.com/topics/monte-carlo-simulation
Disclaimer
The authors alone are responsible for the views expressed in this article. The views mentioned do not necessarily represent the views, decisions or policies of the ISACA NL Chapter. The views expressed herein can in no way be taken to reflect the official opinion of the board of ISACA NL Chapter. All reasonable precautions have been taken by the authors to verify the information contained in this publication. However, the published material is being distributed without warranty of any kind, either expressed or implied. The responsibility for the interpretation and use of the material lies with the reader. In no event shall the authors or the board of ISACA NL Chapter be liable for damages arising from its us.

